
Here are the latest weekly rates of new cases of Covid-19 for every local authority area in Scotland.
The figures, for the seven days to August 7, are based on tests carried out in NHS laboratories and by commercial partners.
The rate is expressed as the number of new cases per 100,000 people.
Data for the most recent three days (August 8-10) has been excluded as it is incomplete and likely to be revised.
The list has been calculated by the PA news agency and is based on data published by Public Health Scotland.
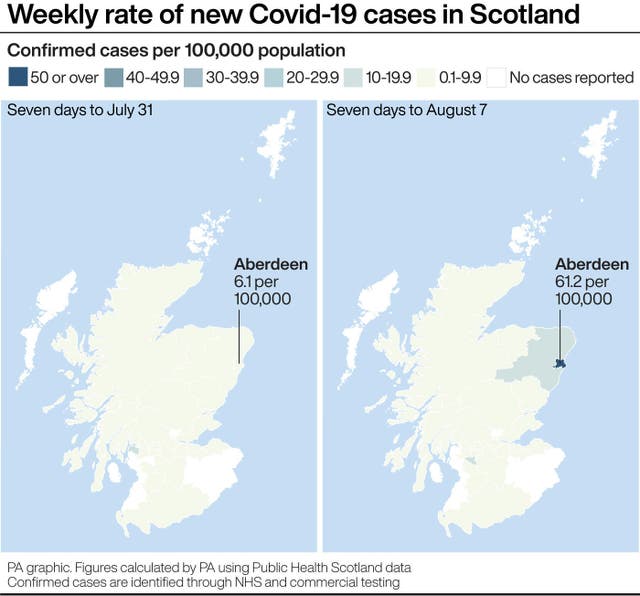
Here is the list in full. From left to right, it reads: name of local authority; the rate of new cases in the seven days to August 7; the number (in brackets) of new cases recorded in the seven days to August 7; the rate of new cases in the seven days to July 31; the number (in brackets) of new cases recorded in the seven days to July 31.
Aberdeen City 61.2 (140), 6.1 (14)
Aberdeenshire 16.8 (44), 3.1 (8)
East Renfrewshire 10.5 (10), 1.0 (1)
East Dunbartonshire 6.4 (7), 4.6 (5)
Glasgow City 5.2 (33), 2.7 (17)
Renfrewshire 5.0 (9), 1.7 (3)
Shetland Islands 4.4 (1), 0.0 (0)
Angus 4.3 (5), 0.9 (1)
West Dunbartonshire 3.4 (3), 4.5 (4)
Dundee City 3.3 (5), 3.3 (5)
Stirling 3.2 (3), 1.1 (1)
City of Edinburgh 3.0 (16), 1.7 (9)
Argyll and Bute 2.3 (2), 1.2 (1)
South Lanarkshire 2.2 (7), 0.6 (2)
Falkirk 1.9 (3), 3.1 (5)
South Ayrshire 1.8 (2), 0.0 (0)
North Lanarkshire 1.8 (6), 1.5 (5)
East Ayrshire 1.6 (2), 2.5 (3)
West Lothian 1.6 (3), 2.7 (5)
Fife 1.6 (6), 1.9 (7)
Midlothian 1.1 (1), 1.1 (1)
Moray 1.0 (1), 2.1 (2)
East Lothian 0.9 (1), 2.8 (3)
Scottish Borders 0.9 (1), 0.0 (0)
North Ayrshire 0.7 (1), 0.0 (0)
Dumfries and Galloway 0.7 (1), 2.7 (4)
Perth and Kinross 0.7 (1), 2.0 (3)
Highland 0.4 (1), 0.4 (1)
Inverclyde 0.0 (0), 11.6 (9)
Clackmannanshire 0.0 (0), 0.0 (0)
Na h-Eileanan Siar 0.0 (0), 0.0 (0)
Orkney Islands 0.0 (0), 0.0 (0)


Comments: Our rules
We want our comments to be a lively and valuable part of our community - a place where readers can debate and engage with the most important local issues. The ability to comment on our stories is a privilege, not a right, however, and that privilege may be withdrawn if it is abused or misused.
Please report any comments that break our rules.
Read the rules here