

AN INTERACTIVE map shows how many car crimes have been reported across Reading in the past six month.
The streets in Reading are always busy (despite all the roadworks) but some of them seem to attract more vehicle-based crime than others.
People may wish to avoid certain areas prone to this type of offending.
READ MORE: Man caught at 74mph in a 40mph zone
A tool created by Co-op Insurance has revealed the number of vehicle crimes in any area - and what roads it is happening in the most.
Vehicle crimes is a broad term, but it can be anything from vehicle theft, theft from a vehicle and vandalism.
How does the tool work?
The interactive map uses data published by the Home Office covering October 2021 to March 2022.
Users can search crime rates in their area by entering a postcode or location into the search bar.
The results are displayed in three coloured circles: red indicates an area that has had six or more incidents, orange shows streets that have seen three to five car crimes and yellow means there have been between zero and two incidents.
READ MORE: Motorist almost four times over the limit among latest residents in court
If you're planning on travelling further afield, the data spans across England and Wales.
A broad look shows that roughly most crimes were reported in West Reading, with a high number of 19 crimes in the past six months between Salisbury Road and George Street.
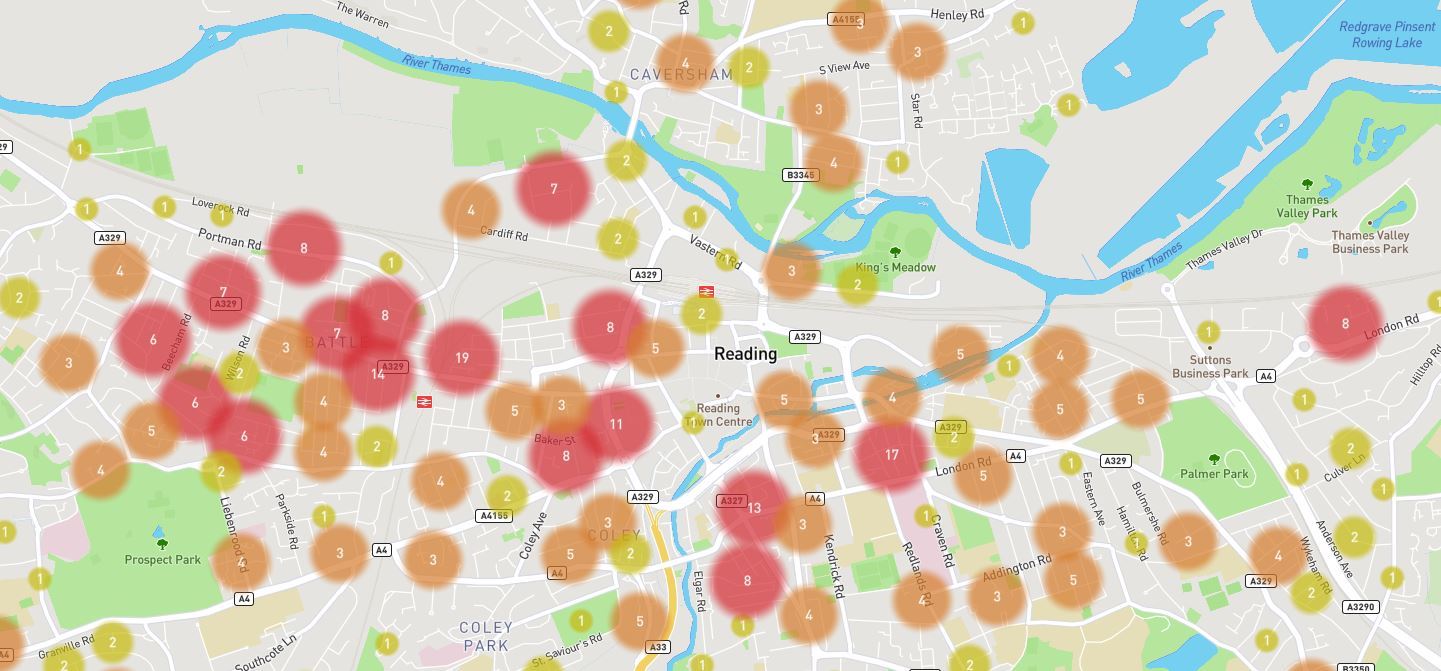
Car crime in West and East Reading
There is also a high cluster of 17 crimes around London Road in East Reading.
Around Emmer Green, there were 13 crimes reported in the past six months.
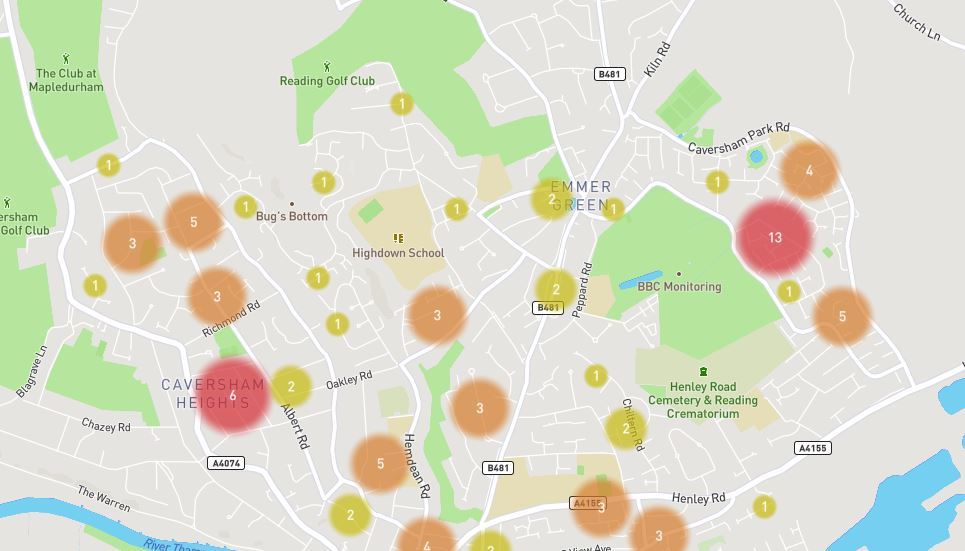
Car crime in Caversham Heights and Emmer Green
Near Whitley, there were clusters of six crimes or more in four different patches.
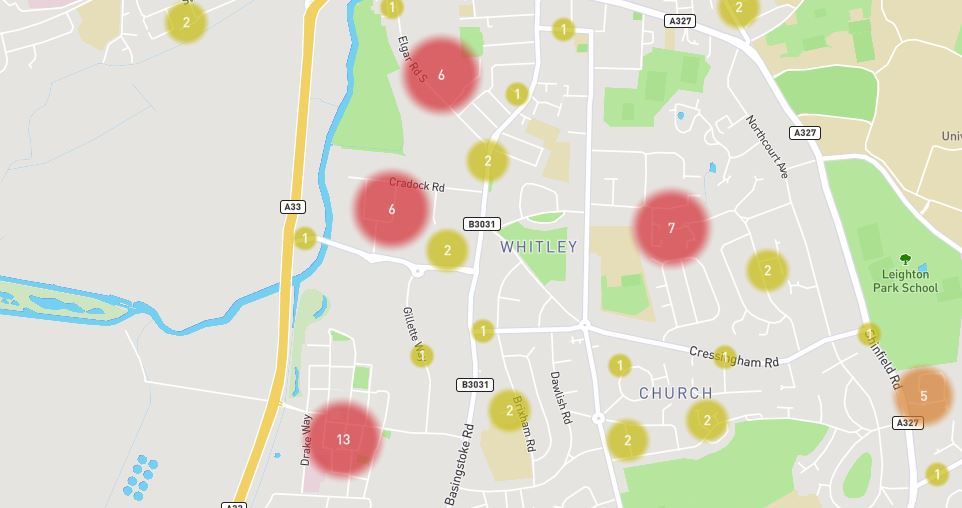
Car crime in Whitley
Take a look at the map to find out how many vehicle crimes in the past six months were reported in a road of interest to you.


Comments: Our rules
We want our comments to be a lively and valuable part of our community - a place where readers can debate and engage with the most important local issues. The ability to comment on our stories is a privilege, not a right, however, and that privilege may be withdrawn if it is abused or misused.
Please report any comments that break our rules.
Read the rules here