

AS the town continues to face restrictions of the third national lockdown, we have rounded up the latest case numbers to show how rates are changing in Reading.
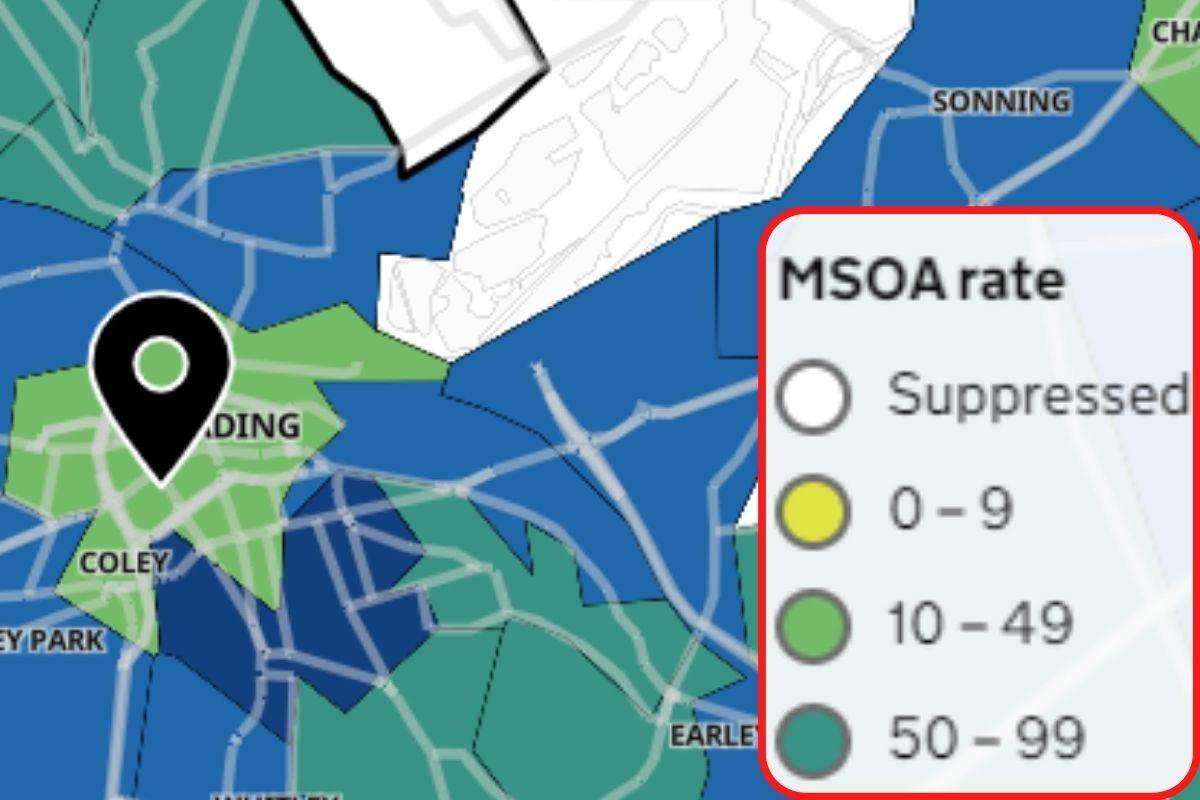
A spread of different colours a few months ago, the Government's Covid-19 map showed almost the whole of Reading as a sea of purple and dark purple in recent months, indicating that the rolling rate for each postcode was above 400 or 800 respectively.
But now some locations are once again changing colour to reveal a significant decrease in cases.
READ MORE: Asymptomatic testing begins in Reading: Are you eligible?
And three areas in the town have recently reported both extremely low rates and cases.
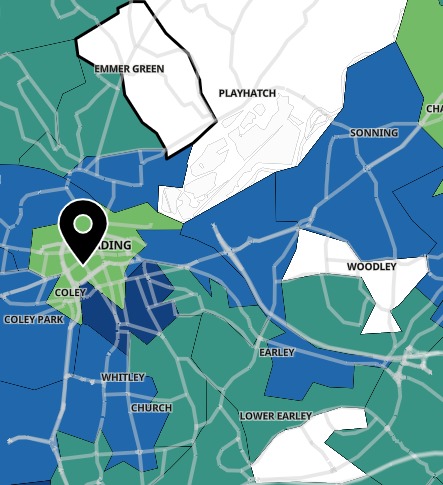
Lower Earley south, Woodley and Emmer Green all had less than three cases in the week leading to February 11, with the exact amount not provided for privacy reasons.
The three areas, shown on the map in white, indicate a promising drop in recent cases.
Low ratings
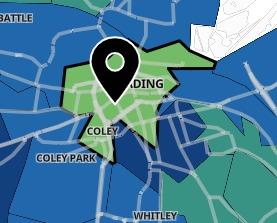
The central Reading area is now showing green - with a rate of under 50.
Central Reading recorded seven cases in the seven days leading to February 11 and, with the low rate, currently stands as one of the least affected areas.
Covid stock image
READ MORE: Interactive map shows location of recent antisocial behaviour reports in Reading
The rolling rate for central Reading is 47.7, a number far lower than the average case rate in England of 148.8.
Leighton Park has also seen a significant decline in cases, with only 5 recorded throughout the period and with a rate of 52.4.
Despite these few areas recording record-low rates, cases across the whole town are dropping.
Seven–day rates are expressed per 100,000 population and are calculated by dividing the seven day count by the area population and multiplying by 100,000.


Comments: Our rules
We want our comments to be a lively and valuable part of our community - a place where readers can debate and engage with the most important local issues. The ability to comment on our stories is a privilege, not a right, however, and that privilege may be withdrawn if it is abused or misused.
Please report any comments that break our rules.
Read the rules here