

WITH Reading still in the midst of the third national lockdown, we have been regularly documenting how cases and rates have been changing in each area.
The Government's Covid-19 map showed almost the whole of Reading as a sea of purple and dark purple in recent weeks, indicating that the rolling rate for each postcode was above 400 or 800 respectively.
But it seems lockdown is having a positive impact, with currently no Reading areas showing up in the purple 'high case' zone.
READ MORE: Number of Covid patients at Royal Berkshire Trust falls by 200 in one week
We have rounded up the areas which have recently recorded the fewest cases, with five areas reporting fewer than 10 cases in recent days.
The map's latest figures show the seven-day rolling rate up to February 9.
PICTURED: Covid stock image
Leighton Park
Total: 4 cases during the week
Difference: Decrease of 10 from previous week
Rate: 41.9
Wokingham Road
Total: 7 cases during the week
Difference: Decrease of 7 from previous week
Rate: 85.8
Lower Earley North
Total: 8 cases during the week
Difference: Decrease of 9 from previous week
Rate: 78.9
Woodley South
Total: 4 cases during the week
Difference: Decrease of 14 from previous week
Rate: 55.2
Southlake
Total: 9 cases during the week
Difference: Decrease of 13 from previous week
Rate: 103.2
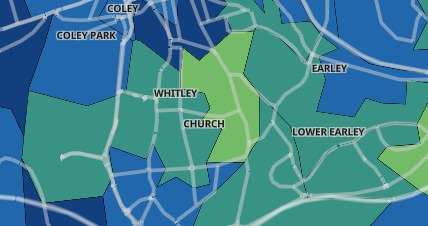
PICTURED: Covid map
READ MORE: The five BEST fish and chip shops in Reading and Bracknell - voted by locals
Despite most areas still having a rate of more than 200, cases across the town are dropping, and infection rates in all areas have seen a decrease.
Seven–day rates are expressed per 100,000 population and are calculated by dividing the seven day count by the area population and multiplying by 100,000.


Comments: Our rules
We want our comments to be a lively and valuable part of our community - a place where readers can debate and engage with the most important local issues. The ability to comment on our stories is a privilege, not a right, however, and that privilege may be withdrawn if it is abused or misused.
Please report any comments that break our rules.
Read the rules here