

AS the town continues to face restrictions of the third national lockdown, we have rounded up the latest case numbers to show how rates are improving in Reading.
A spread of different colours a few months ago, the Government's Covid-19 map showed almost the whole of Reading as a sea of purple and dark purple in recent weeks, indicating that the rolling rate for each postcode was above 400 or 800 respectively.
READ MORE: Police action to be taken on 'nuisance motorbikes' affecting Reading neighbourhood
But now some locations are once again showing as blue, indicating a lower rate of 200 or less.
A few areas in the town though are now being represented by light blue (a rating of less than 200) or even green (a rating of between 10 - 49) and less.
The map's latest figures show the seven-day rolling rate up to February 5.
Covid 19
The following areas have recently recorded rates of less than 100
Leighton Park
Total: 8 cases during the week
Difference: Decrease of 19 from previous week
Rate: 83.8
Wokingham Road
Total: 8 cases during the week
Difference: Decrease of 32 from previous week
Rate: 98
Tilehurst South
Total: 7 cases during the week
Difference: Decrease of 37 from previous week
Rate: 94.8
Burghfield Common
Total: 5 cases during the week
Difference: Decrease of 6 from previous week
Rate: 84
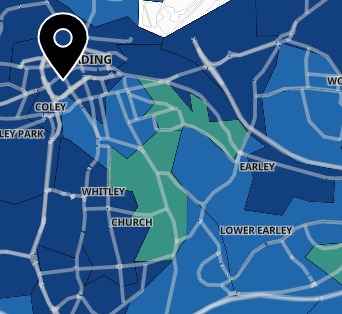
Covid map
Cases across the town are starting to drop, and infection rates in all areas have seen a decrease.
Seven–day rates are expressed per 100,000 population and are calculated by dividing the seven day count by the area population and multiplying by 100,000.


Comments: Our rules
We want our comments to be a lively and valuable part of our community - a place where readers can debate and engage with the most important local issues. The ability to comment on our stories is a privilege, not a right, however, and that privilege may be withdrawn if it is abused or misused.
Please report any comments that break our rules.
Read the rules here