
A map which breaks down the number of coronavirus-related deaths by each postcode has been updated to show where the worst affected areas are in Reading and West Berkshire.
The Office for National Statistics (ONS) has recorded every death in England and Wales where Covid-19 has been mentioned on an individual's death certificate.
The deaths, which occurred between the start of the pandemic last March to December 2020, have either been caused by Covid-19 or the virus has been a 'contributing factor.'
Information used to produce the statistics is based on details collected when certified deaths are registered with the local registration office.
READ MORE: THREE further arrests following Tilehurst death
The map indicates how many deaths have taken place in each area, and breaks them down month by month.
Four locations in the town and across West Berkshire have recorded more than 15 deaths throughout the period, including:
Norcot North
Total deaths: 24
March: 21
April: 3
November: 1
December: 1
Coley Park
Total deaths: 26
March: 21
April: 3
November: 1
December: 1
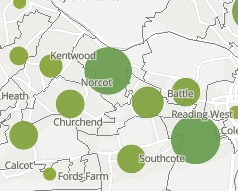
PICTURED: ONS map
Caversham Balmore Park
Total deaths: 17
March: 10
April: 2
July: 1
October: 1
November: 1
December: 2
READ MORE: The QUIRKIEST buildings for sale in Reading
Thatcham Town
Total deaths: 30
March: 24
April: 5
July: 1
As local data is only available up to December, the numbers of deaths in the map will not reflect the latest trends.
In particular, the patterns will not reflect the recent rise in case numbers, as a death from Covid-19 will be reported some time after a positive test.


Comments: Our rules
We want our comments to be a lively and valuable part of our community - a place where readers can debate and engage with the most important local issues. The ability to comment on our stories is a privilege, not a right, however, and that privilege may be withdrawn if it is abused or misused.
Please report any comments that break our rules.
Read the rules here