

AS the town continues to face restrictions of the third national lockdown, we have rounded up the latest case numbers to show the worst affected areas in Reading.
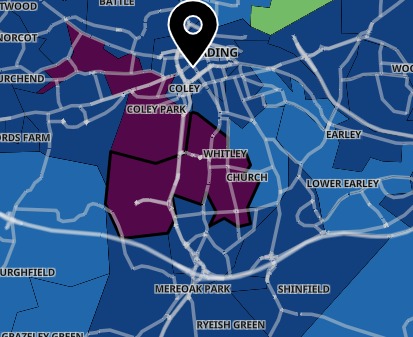
A spread of different colours a few months ago, the Government's Covid-19 map showed almost the whole of Reading as a sea of purple and dark purple in recent weeks, indicating that the rolling rate for each postcode was above 400 or 800 respectively.
READ MORE: When to expect snow in Berkshire
But now some locations are once again showing as light blue, indicating a lower rate of 200 or less.
However, three places remain with Covid rates of more than 400, remaining purple
The map's latest figures show the seven-day rolling rate up to February 2.
Overall, Covid-19 infection rates and cases in Reading are dropping
These are the three areas in the town which are currently shown as purple, indicating a high-case location:
Norcot South
Total: 45 cases during the week
Difference: Decrease of 2 from previous week
Rate: 493.2
Coley Park
Total: 37 cases during the week
Difference: Decrease of 1 from previous week
Rate: 425.4
Kennet Island and Green Park
Total: 50 cases during the week
Difference: Decrease of 20 from previous week
Rate: 440.1
PICTURED: Reading Covid cases
READ MORE: IN MEMORIAM: Death notices in the Reading Chronicle last week
Despite these areas having a rate of more than 400, cases across the town are dropping, and infection rates in all three areas listed have seen a decrease.
Seven–day rates are expressed per 100,000 population and are calculated by dividing the seven day count by the area population and multiplying by 100,000.


Comments: Our rules
We want our comments to be a lively and valuable part of our community - a place where readers can debate and engage with the most important local issues. The ability to comment on our stories is a privilege, not a right, however, and that privilege may be withdrawn if it is abused or misused.
Please report any comments that break our rules.
Read the rules here