

ONE month into the third national lockdown, Covid cases and rates are slowly but surely decreasing in Reading.
We have rounded up the latest case numbers to show the areas currently recording the fewest cases.
A spread of different colours a few months ago, the Government's Covid-19 map showed almost the whole of Reading as a sea of purple in recent weeks, indicating that the rolling rate for each postcode was above 400, with most postcode areas around the 650 mark.
READ MORE: These are Reading's crime HOTSPOTS
But now some locations are once again showing as light blue, indicating a lower rate of 200 or less.
The map's latest figures show the seven-day rolling rate up to January 28.
PICTURED: Covid stock image
The areas recording lower rates include:
Earley
Total: 17 cases during the week
Difference: Decrease of 20 from previous week
Rate: 173.2
Sonning and Woodley North
Total: 15 cases during the week
Difference: Decrease of 1 from previous week
Rate: 195.3
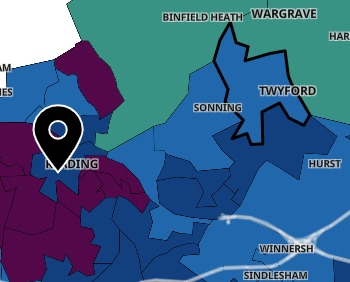
PICTURED: Covid rates map
READ MORE: Police confirm body found outside council offices - updates from the scene
Caversham Balmore Park
Total: 13 cases during the week
Difference: Increase of 3 from previous week
Rate: 162.5


Comments: Our rules
We want our comments to be a lively and valuable part of our community - a place where readers can debate and engage with the most important local issues. The ability to comment on our stories is a privilege, not a right, however, and that privilege may be withdrawn if it is abused or misused.
Please report any comments that break our rules.
Read the rules here