

ALMOST a month into the third national lockdown, Reading is beginning to record fewer Covid cases.
We have rounded up the latest case numbers to show the worst affected areas in Reading.
A spread of different colours a few months ago, the Government's Covid-19 map now shows almost the whole of Reading as a sea of purple, indicating that the rolling rate for each postcode is above 400, with most postcode areas around the 650 mark.
READ MORE: These are the most expensive cars for sale near Reading and Bracknell
The most severe locations are represented in the map in a darker purple, which show places with a rate of above 800 - but lately there has been less of this colour in the town, with only one area currently remaining in this colour.
The map's latest figures show the seven-day rolling rate up to January 24.
Covid-19 PA pic
Battle & Caversham Bridge
This area still remains with a very high rate.
The good news is, cases are still decreasing week on week in the area.
Total: 82 cases during the week
Difference: Decrease of 10 from previous week
Rate: 805
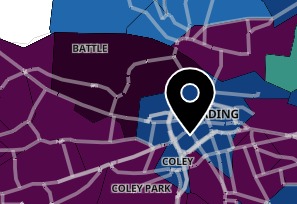
PICTURED: Gov map of Covid-19 in Reading
Areas which have recently dropped from a rate of more than 800 to less include:
Norcot North
Total: 58 cases during the week
Difference: Decrease of 36 from previous week
Rate: 727.5
Southcote
Total: 58 cases during the week
Difference: Decrease of 54 from previous week
Rate: 671.2
Whitley Wood
Total: 52 cases during the week
Difference: Decrease of 10 from previous week
Rate: 730.1


Comments: Our rules
We want our comments to be a lively and valuable part of our community - a place where readers can debate and engage with the most important local issues. The ability to comment on our stories is a privilege, not a right, however, and that privilege may be withdrawn if it is abused or misused.
Please report any comments that break our rules.
Read the rules here