

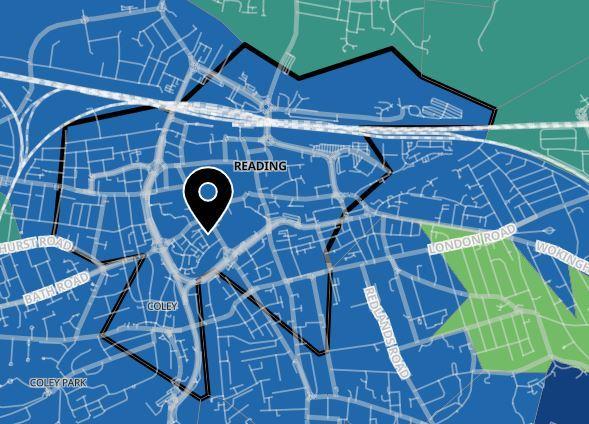
A NEW map shows areas in Reading that have had the most Covid cases diagnosed weekly.
The GOV.UK tool shows how seven–day rates are expressed per 100,000 of the population, and is updated every day.
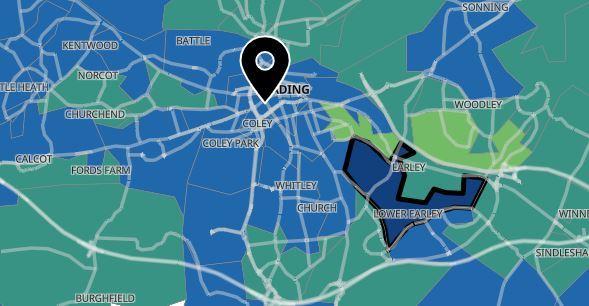
Locally, Lower Earley north has seen the most local cases in the most recent week available (last week), while the Wokingham Road area has seen the fewest.
READ MORE: 'Mental health emergency': Local rise in people detained under Mental Health Act
Data is currently based on the seven days up to October 22.
Lower Earley north has seen a big increase in this period, with 25 cases confirmed.
This is a jump of 16 from the week before, and shows a rolling rate of 246.4.

Data is calculated by dividing the seven day count by the area population and multiplying by 100,000.
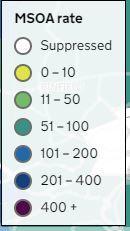
The Middle Layer Super Output Areas (MSOA) rate in the map uses colour to indicate the level of weekly cases across different parts of the town.
In order to help to identify trends or patterns in the data over time, seven-day rolling averages can be calculated.
These are also updated daily.
Each day's observation is combined with the previous three days and the following three days, and the mean of all seven days' figures is presented.
For indicators where the most recent days' data are incomplete, the final few points in the rolling average series will not be displayed, as the averages will increase when data are complete.
To view the map in the GOV.UK site, click here.
The Wokingham Road area has among the lowest rates in the area this week, with four cases diagnosed and a rolling rate of 49.

The map shows that Reading Central has seen a total of 19 cases in the most recent week - an increase of 10 from the previous week.
The 'rolling rate' here is 129.4 - slightly above the national average.
Palmer Park has seen 15 cases this week.
This is an increase of five, and the rolling rate here stands at 141.9.
READ MORE: Covid-19: Reading cases jump by more than 85 during weekend
The map displays weekly data, which is updated everyday.
Local view: The default zoom level shows Upper Tier Local Authorities (UTLA).
Zoom in for more details, including Lower Tier Local Authorities (LTLA) and Middle layer Super Output Areas (MSOA).
Suppressed rates: MSOA level rates are suppressed where there have been fewer than three cases in a seven-day period.
This is to protect the privacy of individuals and prevent disclosure.
More details: Click on an area to see more detailed cases data for the most recent time period available – including seven day case rates and direction of change. When zoomed to very small areas, data for Northern Ireland, Scotland and Wales are not available.


Comments: Our rules
We want our comments to be a lively and valuable part of our community - a place where readers can debate and engage with the most important local issues. The ability to comment on our stories is a privilege, not a right, however, and that privilege may be withdrawn if it is abused or misused.
Please report any comments that break our rules.
Read the rules here